Did you know that unplanned downtime in manufacturing costs American businesses an estimated $50 billion annually? When your CNC equipment suddenly stops, every minute counts. Understanding what those flashing messages on your control panel mean can be the difference between a quick fix and hours of lost productivity.
These diagnostic alerts are actually your machine’s way of communicating with you. They help identify exactly what needs attention in your control system. Rather than seeing them as problems, think of them as helpful guides pointing toward solutions.
This comprehensive resource walks you through everything about Fanuc alarms. You’ll learn how to read messages on your display and implement effective troubleshooting strategies. Whether you’re dealing with a servo issue, spindle problem, or system fault, knowing how to interpret these signals transforms frustrating breakdowns into manageable maintenance tasks.
We’ll cover common conditions, diagnostic techniques, and available resources to help resolve issues efficiently. Fanuc equipment powers countless CNC machines across the country, so having a solid grasp of these messages is essential for anyone working with these control systems.
By the end of this guide, you’ll know exactly where to find help, how to decode alarm messages, and what steps to take when your system signals a problem. You’ll feel more confident and capable when those alerts appear.
Key Takeaways
- Diagnostic messages help identify specific issues in your control system
- Quick interpretation minimizes costly manufacturing downtime
- Understanding alarms transforms breakdowns into manageable tasks
- This guide covers common conditions and troubleshooting techniques
- You’ll learn to decode messages and implement effective solutions
- Proper alarm handling keeps your operations running smoothly
- Confident troubleshooting reduces panic and confusion
Introduction to Fanuc Error Codes
Imagine being able to understand exactly what your equipment is trying to tell you when something goes wrong during production. These diagnostic messages appear on your CNC machine’s display for a very important reason.
Each alarm serves as an early warning system. It alerts you to potential issues before they become major problems. This could include anything from electrical concerns to component malfunctions.
Various conditions can trigger these signals. Bad communication ports, low voltage supply, irregular electrical current, or faulty memory components might cause an alarm. Even rising temperatures within the system can activate these important notifications.
Understanding these messages is crucial for maintaining smooth operations. When a failure occurs, the specific code points directly to the troubled component. This guidance helps your troubleshooting efforts significantly.
These diagnostic tools work across multiple Fanuc controller generations. Whether you’re using older models or the latest systems, the fundamental approach remains consistent. Getting familiar with how these alarms function prepares you for effective responses during critical moments.
Understanding CNC Alarm Code Displays
When your CNC machine suddenly stops working, the display becomes your most valuable source of information. The control panel immediately shows diagnostic messages that pinpoint exactly what needs attention.
How Alarm Codes Appear on Control Panels
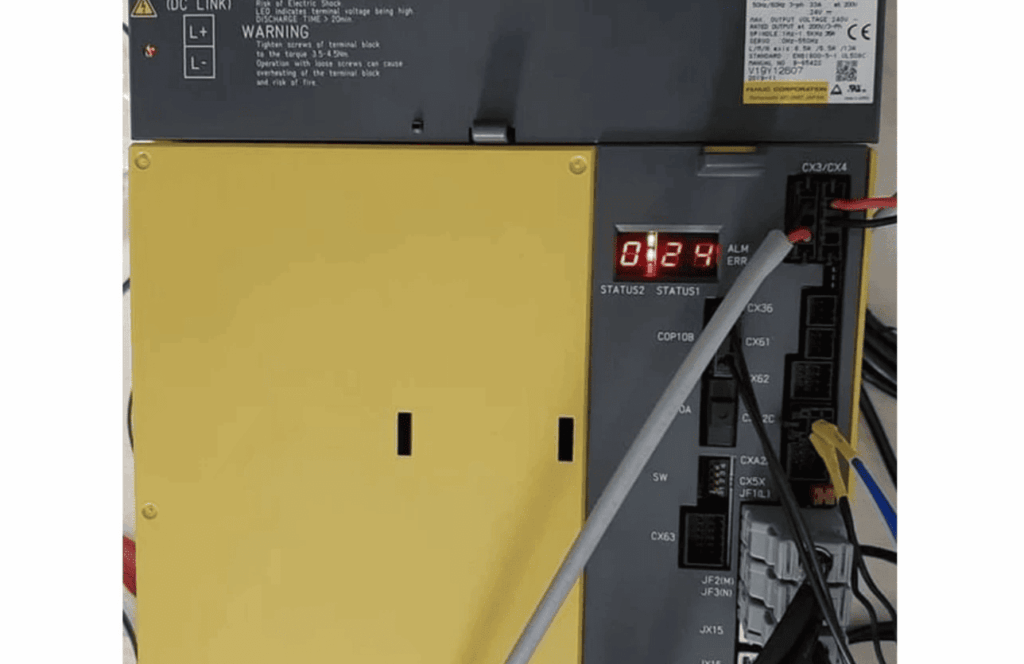
These messages typically appear as combinations of letters, numbers, and symbols. You might see a simple two-digit number or more complex alphanumeric sequences.
The screen shows not just the code but also a brief description. This text indicates which component or system triggered the alarm code. Always note the complete sequence including any hyphens or dots.
Multiple messages can appear simultaneously if several issues exist. This requires addressing them in the proper order based on severity.
Interpreting Visual and Numeric Indicators
Different formats correspond to various problem categories. Servo issues, spindle problems, and power concerns each have distinct code patterns.
The status of your system is reflected in these displays. Learning to quickly read this data helps you move from recognition to solution without delay.
Understanding what appears on your CNC screen is the first diagnostic step. Proper interpretation of these visual cues transforms confusing breakdowns into manageable repairs.
Each number and symbol provides specific diagnostic data. This information guides your troubleshooting efforts effectively. The control system’s communication through these alarm code displays keeps your operations running smoothly.
Diagnosing Fanuc Error Codes
Effective diagnosis begins the instant an alert appears on your control panel display. This systematic approach transforms confusing signals into clear action plans.
Documenting the complete message is your first critical step. Note every character, including hyphens and dots that separate number sequences.
Steps to Identify Faults Quickly
Begin by recording the exact code shown. Include all letters, numbers, and symbols in your notes.
Check the equipment’s history for previous occurrences. Recurring alarm patterns often indicate underlying issues needing comprehensive attention.
Timing provides valuable diagnostic data. Note whether the alert appeared during startup, operation, or shutdown phases.
“The most efficient troubleshooting begins with complete documentation of the alarm circumstances.”
Recognizing Key Patterns in Alarm Data
Similar number sequences frequently relate to connected system components. This pattern recognition helps narrow diagnostic focus quickly.
Systematic troubleshooting follows a logical progression. Verify basic conditions before advancing to complex procedures.
| Diagnostic Approach | Primary Focus | Best Application |
|---|---|---|
| Immediate Response | Code Documentation | Initial Alert Phase |
| Pattern Analysis | Historical Data Review | Recurring Issues |
| Systematic Check | Component Verification | Complex Faults |
Building a reference library of past incidents enhances future diagnostic efficiency. Each recorded event contributes to your troubleshooting expertise.
Common Error Conditions and Their Meanings
Several recurring conditions trigger the majority of diagnostic alerts on industrial equipment. Recognizing these patterns helps you respond appropriately when warnings appear.
Motor Overheat, Fuse Failures, and Overspeed Issues
Thermal management problems often cause equipment shutdowns. When your motor temperature exceeds safe limits, you’ll see a specific alert. This usually indicates excessive load or ventilation issues.
Fuse-related warnings protect different electrical circuits. Each type points to specific power system concerns. DC Link, Input, and Control Power Supply fuses each have distinct meanings.
Speed-related alerts signal potential mechanical or tuning problems. Your equipment monitors rotation rates carefully. Deviations from commanded speed or overspeed conditions require immediate attention.
Cooling system failures generate critical warnings. When internal fans stop working, thermal management fails. These alerts demand quick action to prevent component damage.
- Motor overheat indicates ventilation or load issues
- Fuse warnings protect various power circuits
- Speed deviations suggest mechanical or tuning problems
- Cooling fan failures threaten component safety
Understanding these common conditions helps you prioritize responses. Some alerts allow continued operation while others require immediate shutdown.
Interpreting Error Code Descriptions
When faced with an unfamiliar alert, the solution might be just a button press away on your teach pendant. Your equipment contains built-in documentation that puts detailed explanations at your fingertips.
Using On-Screen Help and Teach Pendant Documentation
Most control systems include extensive help files directly accessible through the interface. The HELP/DIAG button in the lower left corner provides immediate access to this valuable resource.
You can split your teach pendant display using SHIFT+DISP and then press HELP. This brings up context-sensitive guidance for your current screen without leaving the active program.
When an alarm code appears, pressing SHIFT+DIAG shows the current program status and alert details. Clicking “Continue” takes you directly to documentation for that specific error.
This built-in function displays both the cause and recommended remedies for each alarm code. It eliminates guesswork by providing manufacturer-approved solutions based on diagnostic data.
For alerts that are no longer active, access descriptions from the Alarm Log History screen. Scroll to the specific program interruption and press SHIFT+DIAG again for complete information.
Learning these built-in features means you can interpret signals and begin corrective action immediately. This approach minimizes downtime and gets your operations running smoothly again faster.
Hardware and Software Related Faults
When diagnostic messages appear, they typically originate from either physical components or programming elements. Understanding this distinction helps you focus your troubleshooting efforts effectively.
Hardware issues involve tangible parts like motors, cables, and electronic boards. Software problems relate to memory, parameters, and communication protocols. Each category requires different diagnostic approaches.
Servo, Spindle, and Amplifier Alarms
Servo amplifier alerts often indicate problems with motor drive electronics. These can include current control issues or feedback signal disruptions.
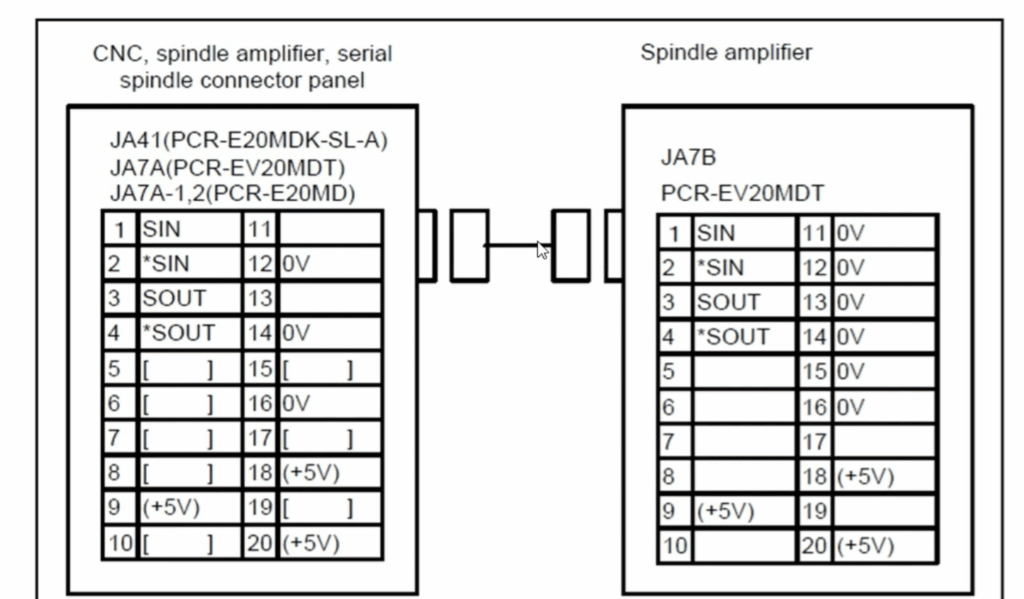
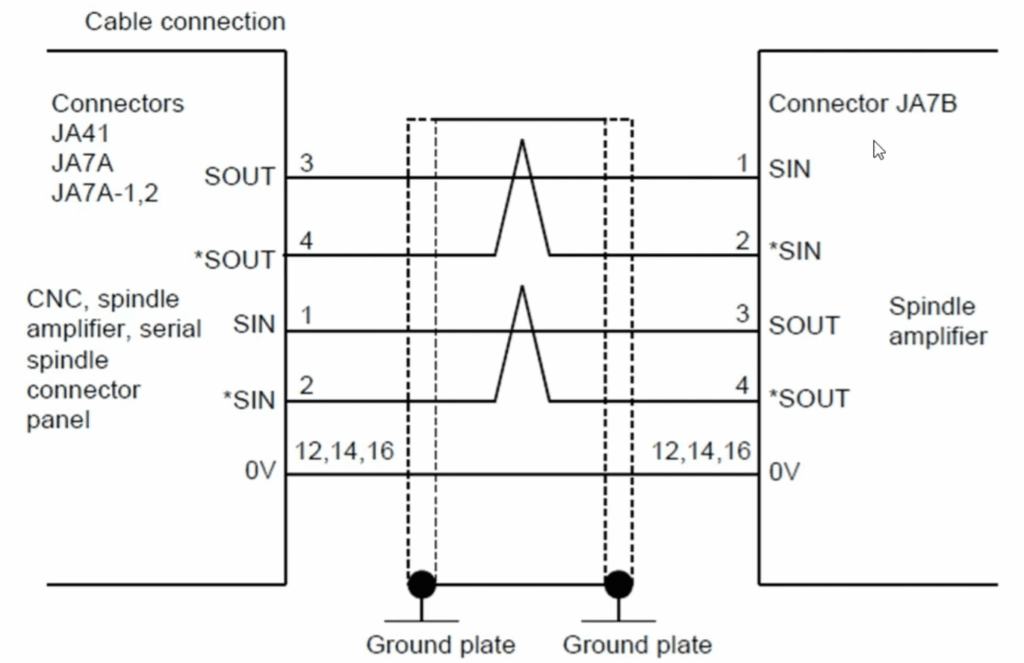
Spindle system warnings frequently involve communication failures or speed control malfunctions. A common alarm like number 69 points to communication problems between the spindle and its amplifier.
Your servo systems rely on precise feedback for accurate motion control. When sensors or wiring fail, you might see messages about disconnected detectors or position coders.
Control Unit, Voltage, and Circuit Diagnostics
Voltage-related alarm messages are critical indicators of electrical health. High or low input voltage warnings signal potential power supply problems.
Circuit diagnostics involve checking electronic components systematically. Look for issues like control circuit errors or communication problems between modules.
Software faults may require memory checks or parameter reloading. These include data memory faults or serial transfer errors that affect system operation.
Proper circuit testing helps identify whether the issue stems from hardware or software sources. This focused approach saves valuable troubleshooting time.
Effective Troubleshooting Techniques
Mastering systematic troubleshooting turns confusing equipment alerts into clear action plans. Your approach makes all the difference between prolonged downtime and quick recovery.
Begin with thorough observation when an alarm appears. Document the exact code and note which axis was active. Record the operation mode and what task was running during the interruption.
Always check relevant parameter settings first. Incorrect value adjustments frequently cause recurring issues, especially after system updates. Compare current settings against known good backups.
“Systematic elimination of simple causes first prevents overcomplicating straightforward solutions.”
For axis-related problems, verify mechanical movement and connection integrity. Ensure each axis moves freely without binding. Confirm all feedback devices have secure connections.
Use manual mode testing at reduced speeds to isolate issues. This helps determine if problems stem from program commands or physical components. Controlled testing provides valuable diagnostic information.
Monitor alarm patterns over multiple occurrences. Consistent timing or conditions reveal root causes that single incidents might hide. Pattern recognition accelerates future troubleshooting.
Document every step of your diagnostic process. Create a knowledge base for your specific equipment. This documentation helps your entire team resolve similar issues more efficiently.
Prioritize multiple alerts by severity and logical sequence. Address power supply concerns before investigating downstream components. This systematic approach ensures comprehensive resolution.
Remote Support and On-Site Repair Options
Even with a solid understanding of diagnostic messages, some situations require expert intervention to get your production line moving again. When basic troubleshooting doesn’t resolve a persistent alarm, professional support services become your most valuable resource.
Phone support, available at numbers like 815-578-9145, connects you directly with experienced technicians. These experts can perform remote diagnostics on your CNC equipment in real time. They guide you through checks for complex servo, spindle, and amplifier issues.
This remote analysis quickly determines if a problem needs simple adjustments or professional repair. It saves significant time and expense compared to immediate on-site visits.
When remote diagnosis confirms a hardware error, a nationwide network of service locations ensures fast turnaround. Having facilities across multiple states drastically reduces repair time. The typical process takes just 3 to 5 days from diagnosis to return.
On-site repair is ideal for large assemblies like spindle units or power supply modules. Removing these components is often impractical. Technicians can fix them directly at your facility.
- Expert analysis for complex spindle synchronization or position feedback errors
- Remote guidance to diagnose servo system alarms
- Fast, nationwide service for hardware issues affecting machine positioning
- Flexible solutions based on the specific alarm and production urgency
Access to both remote and on-site options means you always choose the most efficient path to resolution.
Utilizing Fanuc Error Code Documentation and Resources
You have two powerful ways to access alarm documentation: directly on the machine or through your web browser. While the teach pendant provides immediate help, its small screen can make reading complex details challenging.
On-Demand Help via Teach Pendant and Web Browser
Accessing the same files through your web browser offers significant advantages. Connect to your robot’s IP address while on the same network. This gives you full-screen viewing with better resolution.
Navigate to “Active Program/Variables/Diagnostics” and select the error files available on MD. The TPMENU.DG file lists all menu screens with help links. Different controller versions have slightly different access paths.
The web interface eliminates the teach pendant’s limitations. You get search capabilities and can open multiple documentation pages. This makes extended troubleshooting sessions much more comfortable.
- Better navigation through complex alarm code descriptions
- Easy reference while working at the machine
- Comfortable reading during detailed diagnostic work
- Multiple access points ensure you’re never without resources
Using both methods gives you flexibility. Quick checks work well on the pendant. Detailed research benefits from the web browser’s superior interface. This dual approach keeps your troubleshooting efficient.
Accessing Online Alarm Code Tools
In today’s connected manufacturing environment, web-based tools offer unprecedented access to diagnostic documentation from any location. These platforms complement traditional resources by providing instant lookup capabilities.
Benefits of Web-Based Lookup Tools
Online platforms like the one at linuxsand.info/fanuc transform how you research equipment alerts. Simply enter any alarm code number to receive complete documentation instantly.
These tools provide searchability and the ability to compare multiple alerts simultaneously. You can access them from any device with internet connectivity.
The web interface offers better formatting for complex descriptions. It eliminates the limitations of small teach pendant screens during detailed diagnostic work.
Integrating cURL for Immediate Diagnostic Feedback
For technically-inclined users, command-line integration provides lightning-fast access. Using cURL commands like “curl http://linuxsand.info/fanuc/code-api/SRVO-063” returns raw alarm data directly.
You can create custom shell functions to simplify lookups. Adding a simple function to your .bashrc file makes diagnostic data retrieval nearly instantaneous.
This approach is perfect for quick troubleshooting sessions. It provides immediate feedback without navigating through multiple menus.
| Access Method | Primary Advantage | Best Use Case |
|---|---|---|
| Web Browser Tools | Full-screen viewing and search | Detailed research and comparison |
| Command Line (cURL) | Instant raw data retrieval | Quick troubleshooting sessions |
| Custom Shell Functions | One-command simplicity | Frequent diagnostic work |
Combining these modern tools with traditional documentation creates a flexible approach to alarm interpretation. You’ll always have the right resource for each troubleshooting situation.
Maintenance Tips for Fanuc Systems
Think of maintenance as your equipment’s daily health check-up. Regular care prevents most common issues before they become serious problems. This approach keeps your production running smoothly.
Preventive Practices to Avoid Recurring Errors
Start with cooling system checks during every maintenance cycle. Clean fans ensure proper airflow to motors and amplifiers. This simple step prevents overheating alerts.
Verify axis position accuracy regularly. Use measurement tools to detect gradual drift. Early detection prevents major positioning issues.
Back up your parameter settings after successful tuning sessions. Store multiple value sets with dates and notes. This lets you restore known-good configurations quickly.
“Consistent maintenance documentation turns random incidents into predictable patterns.”
Monitor servo amplifier performance during normal operation. Review axis load data and current values. Trending this information helps predict component needs.
| Maintenance Type | Frequency | Key Components |
|---|---|---|
| Daily Checks | Each shift | Cooling fans, lubrication levels |
| Weekly Inspection | Every 7 days | Motor connections, position accuracy |
| Monthly Verification | Every 30 days | Parameter settings, voltage levels |
Create a maintenance log documenting all occurrences. Include the axis involved and operation mode. This historical data reveals patterns that help prevent future issues.
Train operators to recognize early warning signs. Unusual sounds or vibration changes often precede formal alerts. Proactive attention keeps your systems running reliably.
Conclusion
The journey from alarm confusion to troubleshooting confidence is now complete with the strategies covered here. You’ve gained the essential skills to maintain smooth manufacturing operations.
You can now interpret diagnostic messages effectively. Systematic approaches help you resolve issues quickly. Proper use of available resources enhances your capabilities.
Regular maintenance practices keep your equipment running reliably. Monitoring key components prevents many common interruptions. Documenting occurrences builds valuable expertise over time.
With these techniques, you’re well-equipped to handle any diagnostic challenge. Your manufacturing operations will benefit from reduced downtime and increased efficiency.