While commercial monitoring systems average $487 per unit, makers and engineers now achieve 90% cost savings using credit card-sized tech. This revolution stems from adaptable hardware that handles 128+ sensor inputs – equivalent to enterprise-grade solutions.
Modern DIY monitoring tools combine laboratory precision with plug-and-play simplicity. Unlike bulky alternatives, these compact setups manage everything from climate studies to renewable energy analysis. One engineering team recently tracked solar panel efficiency across 64 measurement points using components cheaper than a video game console.
What makes these systems extraordinary? Expandability meets accessibility. Start with basic temperature tracking using household items, then grow into multi-sensor arrays. The real magic happens when you add live dashboards and automatic cloud backups – features that transform raw numbers into actionable insights.
Key Takeaways
- Professional monitoring capabilities cost 90% less than commercial alternatives
- Supports simultaneous tracking of 64+ environmental parameters
- Easily adapts for renewable energy research and equipment testing
- Scales from basic prototypes to industrial-grade configurations
- Integrates real-time visualizations and remote access features
This guide reveals how to harness these capabilities through practical, budget-friendly methods. You’ll discover component selection strategies that balance performance with simplicity, perfect for both classroom experiments and field research.
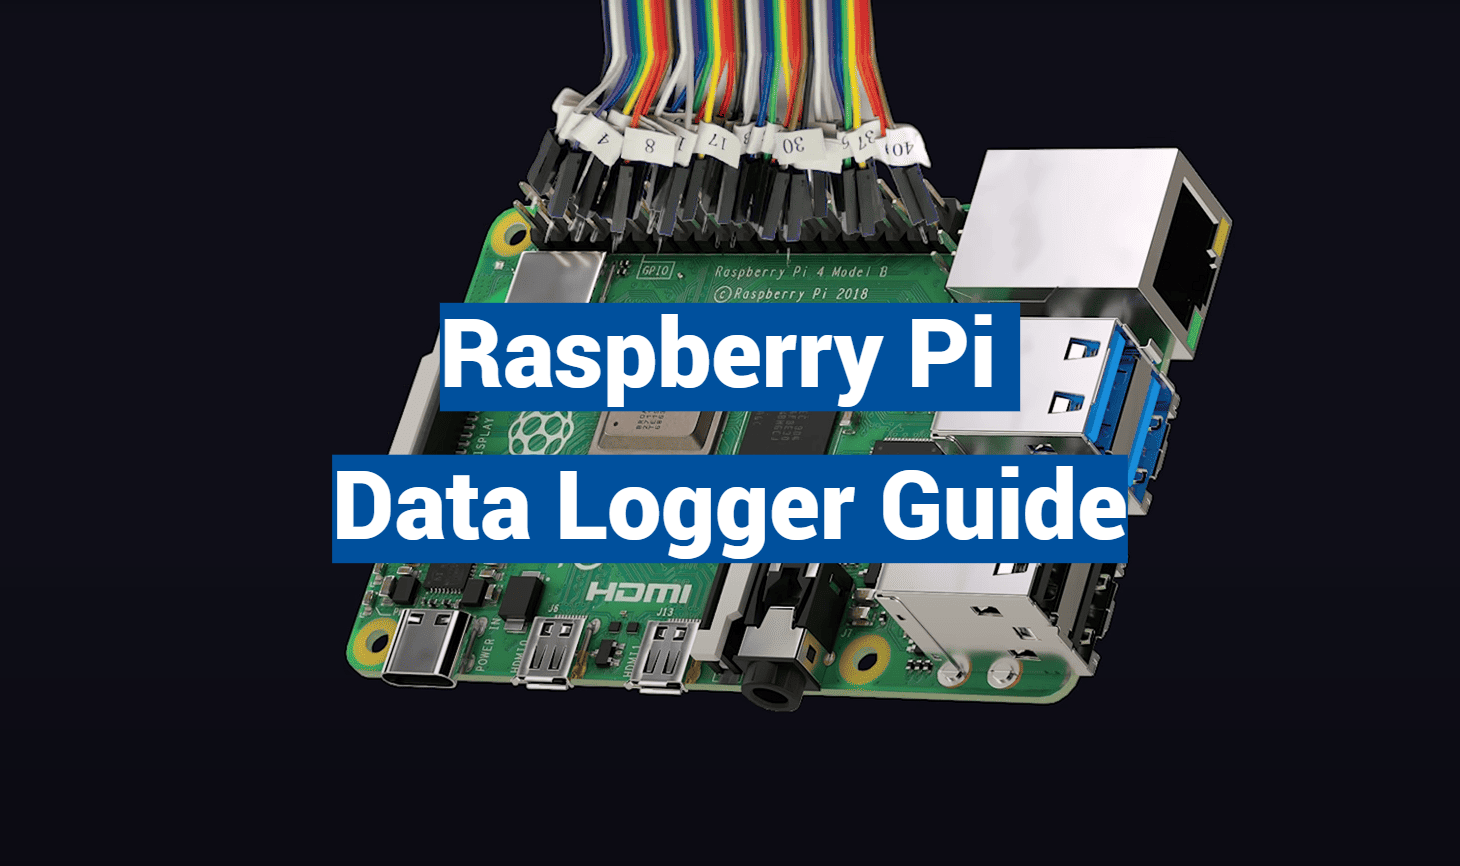
Introduction to Raspberry Pi Data Logger Projects
From farm fields to factory floors, silent observers track vital parameters day and night. These automated recorders capture everything from soil moisture to machine vibrations, turning raw measurements into decision-making gold.
What Makes Modern Monitoring Indispensable?
Automated tracking devices eliminate human error in long-term experiments. They log conditions every second for months – imagine tracking a greenhouse’s humidity changes through all four seasons without manual checks. Industrial teams use them to spot production line inefficiencies, while scientists verify climate models with real-world validation.
Consider solar energy systems: “We caught firmware glitches that drained batteries 23% faster,” shares an engineer at Amped Innovation. Their team monitored 14 solar installations simultaneously, uncovering issues invisible during brief manual inspections.
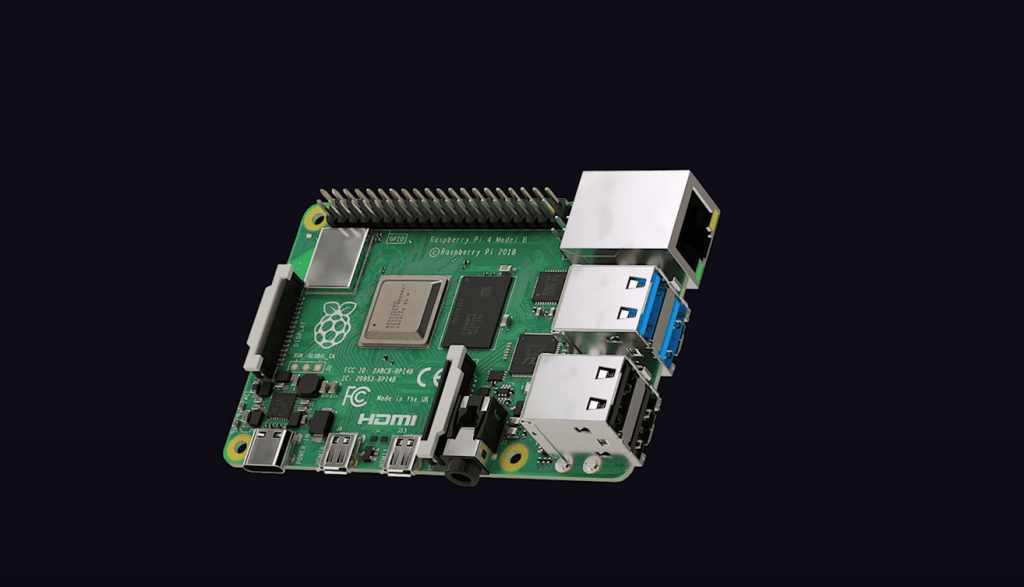
Why Choose Compact Computing Power?
Modern solutions combine lab-grade precision with plug-and-play simplicity. Key advantages include:
- Simultaneous handling of 64+ measurement points
- Real-time processing with instant alerts
- Secure cloud backups alongside local storage
One university project tracked urban heat islands using 40 temperature probes. The setup cost less than a textbook yet matched commercial systems in accuracy. This accessibility opens doors for students and professionals alike – no six-figure budgets required.
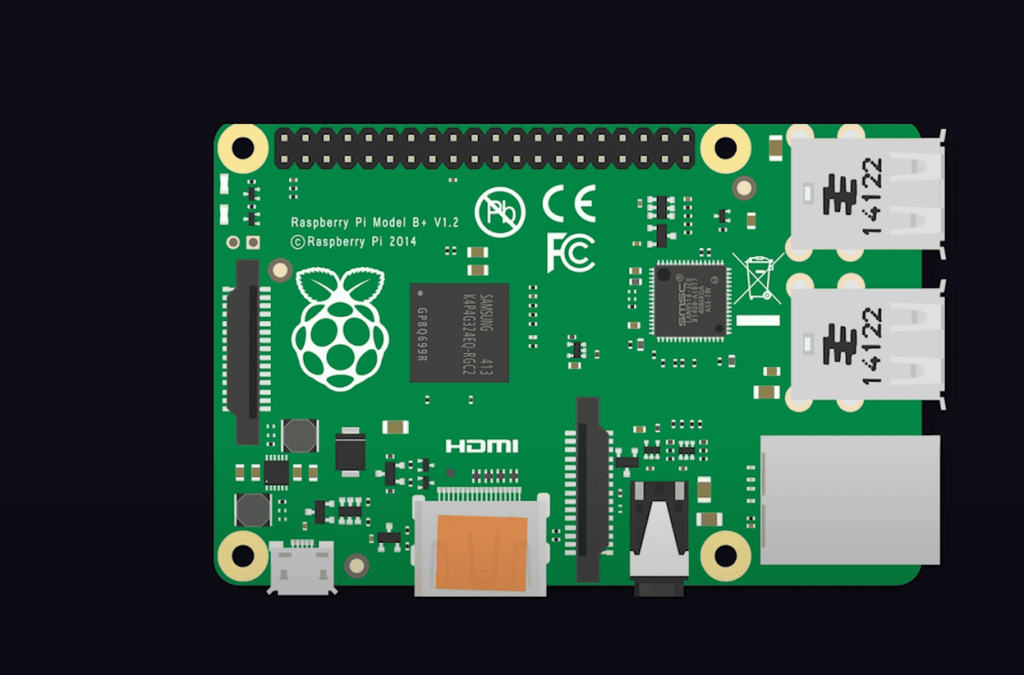
Hardware Components and Wiring Setup
Building a reliable monitoring system starts with smart component selection. The right mix of analog converters and digital sensors transforms basic circuits into precision tools. Let’s explore how to connect these parts effectively.
Selecting and Connecting Sensors and ADCs
The MCP3008 chip shines as an analog-to-digital workhorse. Its eight input channels handle multiple voltage sources simultaneously – perfect for tracking solar cells or battery packs. Pair it with the DS18B20, a durable temperature detector that uses just three wires for power and communication.
Pro tip: Always use separate power lines for sensors and processing modules. This prevents electrical noise from skewing your measurements. Screw terminals on the DS18B20 make temporary connections secure during testing phases.
Wiring the Temperature Sensor and I2C Bus Configuration
Connect the DS18B20’s red wire to 5V power and black to ground. The yellow signal line links to any GPIO port. For I2C devices, follow the color code: SDA (data) and SCL (clock) lines must match your board’s layout. Setting ADD0 to ground locks the device address, preventing conflicts in multi-sensor arrays.
Voltage dividers expand measurement ranges safely. A 1:3 resistor ratio lets you monitor 0-20V systems through 5V-tolerant inputs. Always prototype circuits on a breadboard first – it reveals wiring errors before they become permanent headaches.
Essential Setup for raspberry pi data logger
Transforming components into a precision instrument requires careful software preparation. Let’s unlock your device’s full potential through strategic configuration and smart permission management.
Activating Communication Protocols
Start by enabling I2C through the terminal. Type sudo raspi-config and navigate to Interface Options. For manual setups, edit the blacklist.conf file to remove i2c restrictions. Don’t forget to add dtparam=i2c_arm=on in config.txt – this tells your operating system to recognize connected sensors.
Install critical tools with two simple commands:
sudo apt-get install i2c-tools– diagnostic utilitiessudo apt-get install python-smbus– programming libraries
Optimizing Access Permissions
New users often stumble here. Grant your account I2C privileges using sudo adduser pi i2c. This step prevents endless “permission denied” errors during sensor communication.
Verify your setup with i2cdetect -y 1. This clever command displays connected devices like a digital phonebook. One maker shared: “Seeing those hexadecimal addresses pop up felt like cracking a secret code!”
Remember to update modules.conf and config.txt files for automatic I2C loading at boot. These behind-the-scenes tweaks ensure reliable operation through power cycles and software updates.
Software Configuration and Data Logging Workflow
Bring your monitoring system to life through strategic code design. Thoughtful programming transforms raw sensor inputs into organized datasets ready for analysis.
Setting Up Python Scripts and Logging Commands
The main.py file acts as mission control. Here, you’ll define how often measurements occur and where they’re stored. A typical configuration specifies:
- Measurement intervals (e.g., every 60 seconds)
- Active input channels
- Voltage conversion ratios
- Storage locations for collected information
Python’s time and csv modules handle scheduling and formatting. Error-checking loops prevent crashes during extended runs. One engineer notes: “Our scripts ran flawlessly for 147 days straight – longer than some commercial systems!”
| File Type | Best For | Software Compatibility |
|---|---|---|
| .txt | Quick readings | Basic text editors |
| .csv | Complex datasets | Spreadsheets, databases |
| .log | System diagnostics | Developer tools |
Managing Log Files and CSV Data Storage
Organize files using clear naming conventions like Location_SensorType_Date.csv. Store related files in dedicated folders – temperature readings shouldn’t mix with voltage tests.
For background operation, add & after your command. This lets the program run continuously while freeing the terminal. Always test new configurations before deploying long-term projects.
Real-Time Data Monitoring and Visualization
Numbers transform into actionable insights when visualized effectively. Modern tools turn endless streams of measurements into clear patterns, helping users spot trends faster than manual analysis ever could.
Implementing Live Plotting with Matplotlib
Python’s Matplotlib library brings numbers to life through animated graphs. Set up rolling displays that show the latest 600 readings – new values slide in from the right while older ones exit left. This approach maintains smooth updates without overloading memory.
Performance varies by hardware capacity. Systems with 4GB RAM handle 20 updates per second during live graphing. Disabling visuals boosts rates to 50Hz for pure recording tasks. “Choosing between visuals and speed depends on your project’s needs,” advises a thermal imaging researcher.
Streaming Data to Cloud Services for Remote Viewing
Services like Initial State turn local measurements into global insights. Upload information to secure servers using simple API calls, then access polished dashboards from any web browser. Multiple team members can view synchronized feeds simultaneously.
Configure alerts for critical thresholds – get instant emails when temperatures exceed safe limits or voltage drops unexpectedly. Cloud storage also acts as backup protection if local files get corrupted during long-term tests.
| Visualization Method | Update Speed | Best Use Case |
|---|---|---|
| Local Live Plots | 20 Hz | Immediate troubleshooting |
| Cloud Streaming | 5 Hz | Team collaboration |
| CSV Logging | 50 Hz | High-speed recording |
Conclusion
In workshops from Nairobi to Nebraska, innovators are redefining environmental tracking. Your newly built system proves professional-grade monitoring doesn’t require corporate budgets. Whether testing solar panel firmware or seasonal battery performance, this tool adapts to challenges engineers face daily.
Eight measurement channels and live graphs transform raw numbers into solutions. The open-source design invites customization – swap sensors, tweak scripts, or design enclosures as your project grows. Shared Python files and circuit diagrams let you build upon work done by a global community.
Consider this your launchpad. Modify scripts in the /home/user directory for specialized tasks. Add LED indicators during your next test phase. Each upgrade sharpens skills in embedded systems and IoT development.
Remember: great discoveries often start with simple samples. One engineer’s basement experiment became a renewable energy breakthrough. Your organized CSV files and clever code might spark the next leap forward. Where will your logging journey lead?